Blog
Forecasts of farm gate milk prices in Canada: lower prices in 2025?
Sebastien Pouliot, Ph.D.Series: Agriculture
At the beginning of October, the Canadian Dairy Commission (CDC) is set to release the results of its annual cost of production study. The estimated change in production costs and the inflation rate measured from the Consumer Price Index enter in the National Pricing Formula to determine the annual adjustment in farm gate milk prices, usually applied in February of the next year. This is described at this page for 2023.
In this post, I begin by examining the price adjustment Canadian dairy farmers can expect in February 2025. I find that it is quite possible the CDC will lower the price of milk by about 2%. The last time the CDC lowered the price of milk was in 2015. Next, I forecast farm gate milk prices by province using data from Statistics Canada, assuming the CDC lowers farm gate milk prices by 2% in February 2025.
Last February, I wrote about Quebec farm gate milk prices. I forecasted Quebec farm gate milk prices to decline until September and then to rise in the fall. That’s not what happened with farm prices being higher than my forecasts. I’m happy of that outcome as farmers are better off than what my model predicted. I have some clues about why my model forecasted lower prices. More on that in the last section of this post.
Farm gate prices to decrease in February?
The CDC typically releases at the beginning of October the results of its annual cost of production study. The National Pricing Formula determines the annual adjustment in farm gate milk prices by averaging the annual inflation rate for consumer prices and the rate of change in milk production costs.
The inflation rate has significantly declined over the last year. In the most recent data from August, the inflation rate is at 2.0%, compared to 4.0% in August 2023.
Figure 1 shows estimated milk total production cost. I followed the indexation from the CDC described in its cost of production study to estimate and forecast monthly production costs. You can read the 2023 study at this link. You can see from the figure that the total cost has been declining, by about 6% between summer 2023 and summer 2024. This is my estimate but it should not be too far from what the CDC will find. The CDC will use the cost study for 2023, scheduled for release in October 2024, to calculate the change in production costs.
Figure 1: Estimated milk total production cost
From the estimated change in the costs of production and the inflation rate, the farm gate price could decline by 2% (+2% x 0.5 + -6% x 0.5). However, under the exceptional circumstances mechanism, the adjustment in the farm gate milk price might not follow the formula. There are three criteria for the exceptional circumstances mechanism:
- Stakeholders make the request;
- Large difference between the inflation rate and the growth of production costs (8% here);
- Estimated production costs exceed producer revenues.
Meeting the first criterion will depend on stakeholders. The second criterion is met. I do not think the third criterion will be met. Thus, it seems like a real possibility that milk prices will decline in February 2025. At the very least, dairy farmers should not expect the CDC to increase farm gate milk prices in 2025.
Farm gate price forecasts
I use two models to forecast farm gate milk prices by province. Here are brief details for those interested.
- Milk component models: This is the type og model I used in my February post. The farm gate price forecasts build from forecasts of the volumes and prices by milk classes.
- Time-series models: These models are a mix of elastic-net and ARIMA models.
The models are estimated separately for each province. The time-series models tend to produce smoother forecasts than the milk component models.
I assume CDC lowers farm gate milk prices on February 1, 2025, by 2%, consistent with my calculations above. Nonetheless, the models forecast slightly higher prices in 2025 compared to 2024. How is that possible? The CDC only influences prices. Domestic and international market forces play an important role, in particular in influencing the end-use of milk.
Maritime provinces
Figure 2 shows that farm gate milk prices vary considerably between maritime provinces. The time-series models forecast prices to decline in August but then to grow for the rest of the Fall. Afterward prices will decline following the usual seasonality.
The milk components models for New Brunswick and Nova Scotia forecast lower prices in August and September but then for prices to increase. The price drop in August and September in New Brunswick are steep and I doubt they could be this strong. The milk component model for Prince Edward Island forecasts prices to begin increasing in August.

Figure 2: Farmgate milk prices in Maritimes provinces
Quebec and Ontario
Farm gate prices in Quebec and Ontario usually track each other quite well and the models forecast similar prices for the two provinces. Prices are forecast to trend up while following seasonal patterns. The milk components models are more optimistic about prices increasing over the next year. Prices should be slightly higher in 2025 but increase at a slower rate than in the previous years.

Figure 3: Farmgate milk prices in Quebec and Ontario
Western provinces
Farm gate milk prices in the Western Milk Pool (WMP) vary across provinces. There appear to be more volatility for Saskatchewan milk prices. Milk prices in Alberta and British Columbia are higher than in Manitoba and Saskatchewan and higher than in Eastern provinces. The forecasts are similar to those for Quebec and Ontario: prices should generally trend up while following seasonal patterns, resulting in a modest increase in 2025 compared to 2024.

Figure 4: Farmgate milk prices in Western provinces
Comparison of Statistics Canada and Producteurs de lait du Québec milk prices
In my February post, I used monthly data from Les Producteurs de lait du Québec (PLQ), where the price is measured as the value to farm of one hectolitre at the average composition. My forecasts in this post use data from the Statistics Canada table 32-10-0077. Here, I examine whether the two data sources give comparable values.
Figure 5 compares prices for the data from PLQ and Statistics Canada. The figure shows a gap between the two series but that they move in sync until August 2021. The gap is mostly explained by transportation costs.
The area in light blue is the period on and after August 2021. From that date on, the prices from the two sources do not track as well. What happened in August 2021 is that PLQ introduced a new pricing method that gives greater incentives to producers to increase the relative butterfat composition of their milk. What I do not understand is why that change caused prices to no longer track each other. PLQ reports a value at the average composition. Although components pricing changed, it should not change the fact the value at the average composition can be calculated as the total revenue to farm divided by the total milk volume. My understanding of how Statistics Canada calculates the average price is by surveying farmers and asking for the average price they received, and by using administrative data. Thus the two sources should produce very similar values. It does appear there were a break in the way the average price is reported by PLQ.
Figure 5: Comparison of farmgate prices published by Statistics Canada and the PLQ
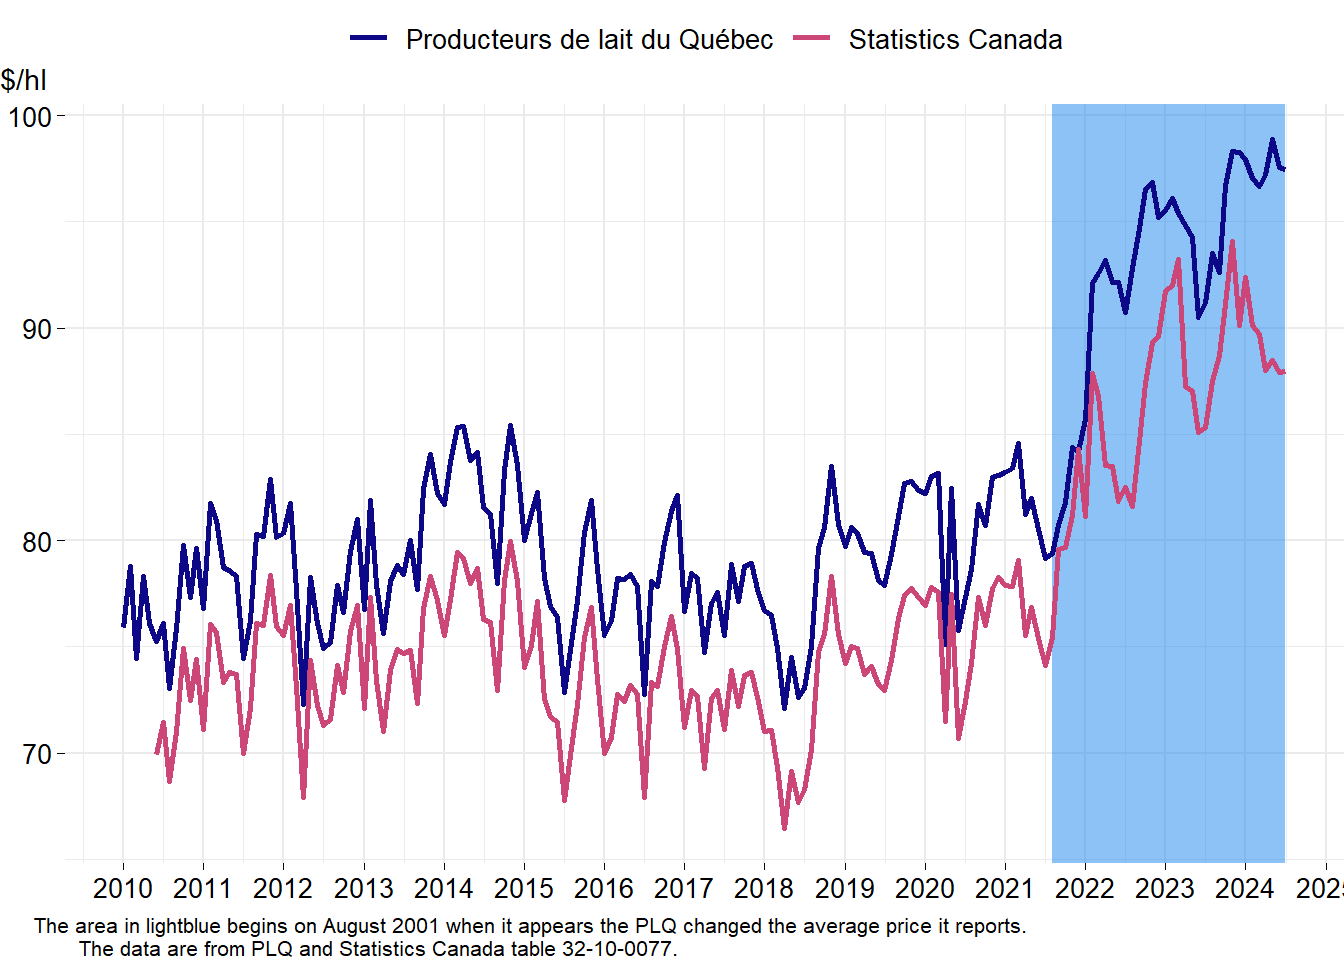
Figure 5 gives a hint as to why my model forecasted in February declining prices. The prices reported by Statistics Canada declined, consistent with my forecasts, but those reported by PLQ stayed relatively flat. In my previous post, I estimated the model using data from PLQ and most of the data series were from before August 2001. Thus, my model forecasted prices as if there never had been a changed in the way the average price is reported, hence producing a forecast more consistent with Statistics Canada data. As I use data from Statistics Canada in this post, I do not expect this will be a problem this time.