Blog
The growth of farmland values in Canada
Sebastien Pouliot, Ph.D.Series: Agriculture
Farmland values have been growing rapidly over the last few years. According for Farm Credit Canada (FCC), farmland values in Canada have grown on average by 11.5% in 2023, after growing by 12.8% in 2022. To entrants in agriculture, high farmland values are an important obstacle. To incumbent farmers, especially those nearing retirement, high farmland values can be considered a blessing.
In this blog post, I examine how farmland values have changed through time and geographically in Canada. I use data for cultivated, non-irrigated land from FCC. These data are, to my knowledge, the best publicly available farmland value data for Canada. They are the basis for the farmland values reported by Statistics Canada. For most of the discussion that follows, I do not use the data from Statistics Canada because they also include the value for buildings on farmland and they are not available at the regional level.
Farmland values vs. the stock market
Is it better to invest in farmland or in the stock market? I’ll answer this question from a historical perspective by looking at the return of investing $100 in farmland versus investing $100 in the stock market in 1996, the year the available FCC data begin.
The figure below shows how $100 invested in farmland or in the stock market would have grown through time. Each gray line shows the return from an investment in farmland for a region. The S&P/TSX composite index is in blue and the S&P 500 is in red. The S&P/TSX composite index is a measure of the expected return from investing in Canadian stocks in Toronto while the S&P 500 is a measure of the expected return from investing in US stocks (New York).1 The S&P/TSX (Toronto) does not set the bar high in terms of yield, averaging a 4.8% annual return. The S&P 500 (New York) average annual return was 7.1%.
Note that the returns to owning farmland I discuss only consider the direct return from buying and selling land. They do not take into account revenues from exploiting or renting out farmland, and costs such as property taxes. Similarly, the stock indices are not corrected for dividends. In both cases, the data tend to underestimate returns but I do not know to what extent. These considerations could affect the comparisons below.
The figure shows that for almost every region, the return to farmland by far exceeds the return from investing in the stock market. Regions for which the average annual return from owning farmland is below the return from investing in the S&P/TSX (Toronto) are Prince in Prince Edward Island, Truro-Shubenacadie and Pictou-Antigonish in Nova Scotia. Regions where the average annual return beats the S&P/TSX (Toronto) index but is below the S&P 500 (New York) are Kings and Queens in Prince Edward Island, Western in New Brunswick, and Cariboo-Chilcotin and Peace-Northern in British Columbia.
Farmland values increased spectacularly in several regions, in particular in Ontario and Quebec. The highest average annual return is for the Laurentides-Lanaudière region in Quebec at 11.6%. A $100 investment in farmland in Laurentides-Lanaudière in 1996 is worth $1,920 in 2023. Four regions in Ontario follow: Mid Western, Central West, South East and South West. Two regions in Quebec are next: Chaudière-Appalaches and Montérégie.
Figure 1: Return on investment in farmland by region between 1996 and 2023
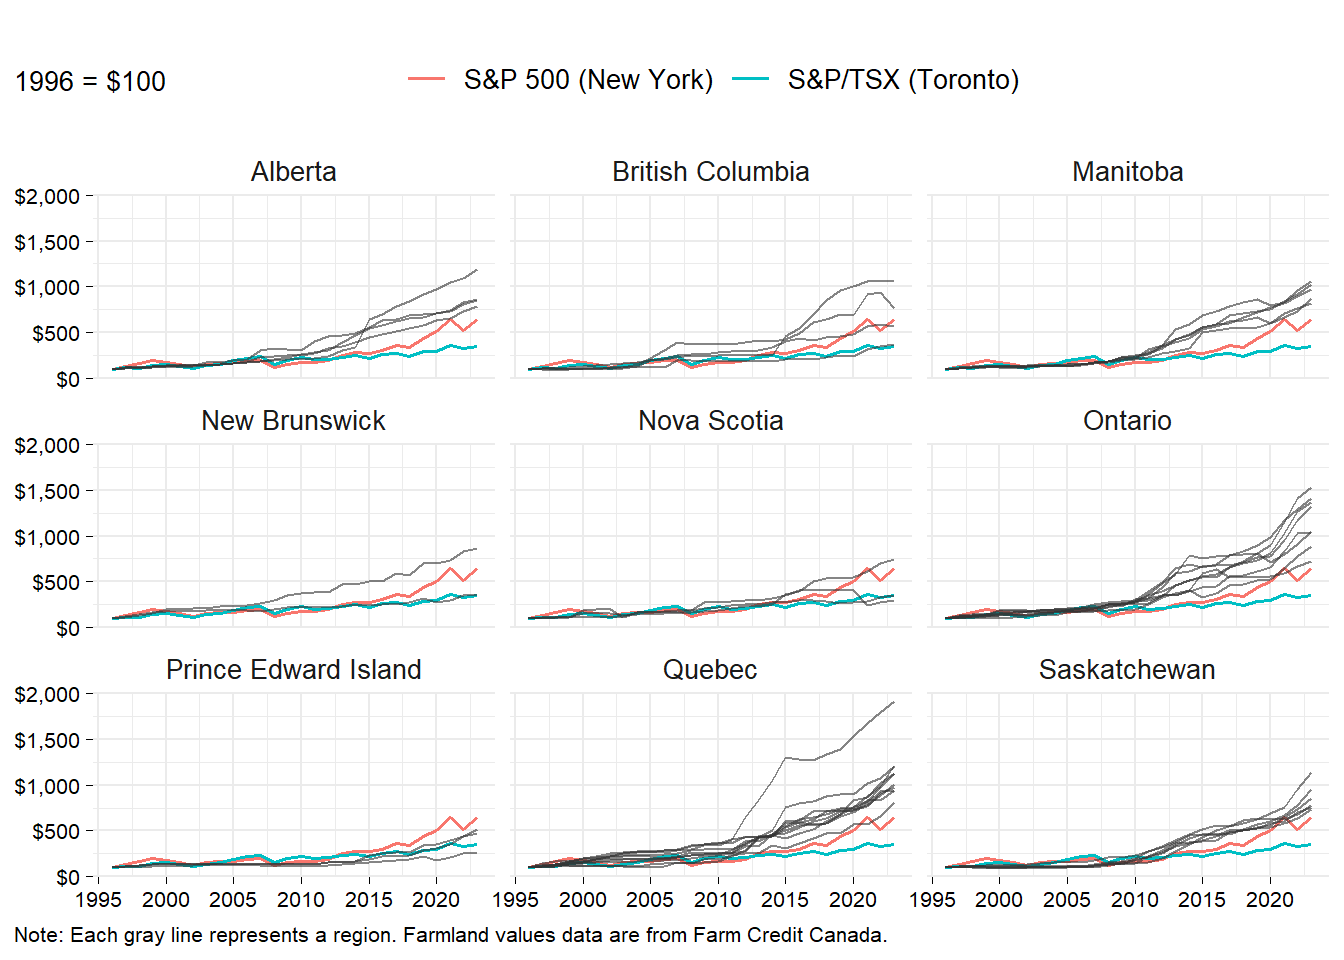
Table 1 shows the average return to farmland by province, weighted by area (more on that below). In all provinces, the average return is above the S&P/TSX (Toronto). The average return in only two provinces is below the S&P 500 (New York): Prince Edward Island and Nova Scotia. The table includes the standard deviation as a measure of risk. Based on that measure, the risk is lower from investing in farmland than investing in the S&P 500 (New York) or in the S&P/TSX (Toronto).
Overall, these data tell us that farmland was an excellent investment between 1996 and 2023. In most regions of Canada, the return on farmland exceeded the average return from the stock market, at a lower risk!
Mapping farmland values in Canada
Let us now have a look at farmland values across Canada on maps to gain a better understanding of the geography of farmland values. It is not easy to map farmland values through time. To simplify, I’ll approach the task in two steps. First, I’ll map farmland values for selected years. Then I’ll show an animation of how farmland values have changed through time.
FCC shows farmland values on maps where regions are coloured according to farmland values, regardless of the surface of land that is actually farmed. I’ll take a different approach by colouring only the surface of land corresponding to the agricultural ecumene to give a more accurate visual.2 Statistics Canada defines the agricultural ecumene as the areas where the main agricultural activities take place.
Figure 2 shows maps of farmland values for 1996, 2005, 2014 and 2023. As farmland values increase, the map darkens. This is true for all regions as farmland values have increased everywhere. There is consistency through time with the highest-valued land in 1996 being also the highest valued in 2023. The most valuable land is in the South Coast region near Vancouver in British Columbia. The agricultural land in that region cover a small area and is barely visible in the maps. Elsewhere, the most valuable land is along the Saint Lawrence River, by lake Erie and lake Ontario, where most of Canada’s population is located.
Notice how much more farmland there is in the Prairies provinces compared to the rest of Canada. Farmland in the Prairies tends to be more affordable than farmland in Ontario, Quebec and British Columbia. Also note that there is a net difference in the value of land in Alberta and Saskatchewan.
Figure 2: Maps of farmland values per acre in Canada for selected years

The animation below offers a more dynamic view. Observe that only in rare cases that farmland values decline year to year. The animation shows from the map darkening rapidly that farmland values increased fast in the 2010s, contrasting with the prior years when farmland values were more stable.
Figure 3: Map of farmland values per acre in Canada

Farmland values in Canada and provinces
I show below average farmland values across Canada. This is not something that FCC shows in its annual farmland value report, although FCC gives the annual average percentage change in farmland values for Canada. I calculated average farmland values by weighting regions by the area covered by the agricultural ecumene for the 2021 Census of Agriculture. Table 2 shows the results, and also contains values by province and the annual percentage change.
The annual percentage changes I calculated are different than those reported by FCC. My guess is that it mostly comes from different weighting, and from only considering cultivated non-irrigated farmland. I do not know what weighting FCC uses when aggregating values. I tried as an alternative to weight the data according to the land use data from the Census of agriculture but I could not replicate FCC’s results based on the annual percentage changes of individual provinces.
Concluding remarks
The data presented above show that for most regions of Canada, investing in farmland in 1996 would have been a great investment. This conclusion holds true for the period considered and thus someone should not conclude that the return from investing in farmland always exceeds the return from investing in the stock market.
Table 3 shows the average annual return by decade from investing in farmland in Canada and the average annual return in the stock markets in Toronto and New York. The farmland value data are from Statistics Canada, and thus also include the value of buildings, unlike the FCC data I used above. These data allow me to go furhter back in time than the FCC data.
From table 3, an investment in the S&P/TSX (Toronto) or the S&P 500 (New York) during the 1980-1990 or the 1990-2000 decades would have done better than an investment in farmland for most provinces. Afterward, the return from investing in farmland exceeds the return from investing in the stock market. The 1980s and 1990s were not kind to agriculture with stagnating or declining agricultural commodity prices and a wave of bankruptcies in the 1980s. In the 2000s and 2010s, growth in biofuel production caused agricultural commodity prices to rise, and demand for farmland to grow, causing farmland values to increase.
What to expect for the next decade? Farmland values will follow commodity prices and profitability in agriculture. If there is new demand for agricultural commodities, for example from increased biofuel production for airplanes, I expect farmland values to continue their strong growth. If agricultural commodity prices stagnate or decline, then farmland values may decline. Climate change will also play a role in future farmland values, but it is difficult to predict what that role will be.
-
I did not convert the S&P 500 stock index in Canadian dollars. The exchange rate in 1996 was about the same as the one that prevailed in 2023. ↩︎
-
In most cases, I was able to math the borders of the regions used by FCC with the borders of the census divisions. In a few cases, I could not exactly match the borders. The most notable case is Saskatchewan where the line that divide regions in the middle of the province is not the same. My guess is those differences have a small incidence on the results I’ll show below. ↩︎