Blog
What do recession indicators tell us, again?
Sebastien Pouliot, Ph.D.Series: macro
Tags: yield, recession, inflation, interest rates, Bank of Canada
We’ve seen signs of a slowdown in economic activity in Canada lately. GDP declined 0.3% in the 3rd quarter of 2023. When first announced, GDP growth for the second quarter of 2023 was slightly negative, but was revised upward to 0.3% with the release of the third quarter data.
I wrote about recession indicators at the beginning of 2023. At that time the yield curve had been showing signs that a recession was coming, but the Sahm’s rule recession indicator did not show evidence that a recession was at the doorstep. Let’s see what these indicators tell us now. I also briefly discuss interest rates and the labour market.
Why are we concerned about the risk of a recession? Recall that with the high inflation rates observed after the pandemic, the Bank of Canada adopted quantitative tightening measures and raised its policy rate to slow down inflation. The best outcome will be a soft landing where inflation returns to the 2% target, but the economy continues to grow.
Before checking the two recession indicators, it’s worth mentioning that the Chaire en macroéconomie et prévision (in French only) finds (in French only) unlikely that Canada will be in recession in the next two years but there will be an important economic slowdown in 2024, continuing in 2025. Moreover, Desjardins forecasts a short and shallow recession in the first half of 2024, but that the economy will recover afterward with the Bank of Canada cutting its policy rate.
Yield curve inversion is meaningless
The yield curve shows the relationship between the yield and the maturity of securities. In a normal market, yields increase with maturity as investors ask for higher returns on riskier long-term investments. The yield curve is inverted when yields decline with maturity. This is a situation where investors consider that the near term is riskier than the long term. Inversion of the yield curve is considered an early signal of a recession.
The animation below shows the yield curve between January 2018 and November 2023 in two panels. The panel on the left shows the yield curve: on the horizontal axis is maturity increasing from left to right and on the vertical axis is the yield. The panel on the left compares the yield on the 3-Month treasury bill and the 10-Year bond to determine when there is an inversion. The area in blue shows the spread when the yield on the 10-Year bond exceeds the yield on the 3-Month treasury bill. The area in orange shows the spread when the yield on the 10-Year bond is lower than the yield on the 3-Month treasury bill, that is, when the yield curve is inverted.
The animation shows that the yield curve has been inverted for nearly a year and a half. Yet, Canada has not been in recession. Such a continuous false positive signal makes inversion of the yield curve a meaningless indicator that a recession is coming. We cannot conclude from the yield curve that a recession is coming.
Figure 1: Canada's yield curve inversion
The next animation displays the effective interest rates paid by households and businesses on the right panel. It shows how the Bank of Canada quantitative tightening measures and increases of its policy rate tightened credit conditions for households and businesses. Interestingly, the household average interest rate has flipped back above the average business interest rate recently.
Figure 2: Canada's yield curve and average household and business interest rates
Sahm’s rule recession indicator weakly indicates a recession
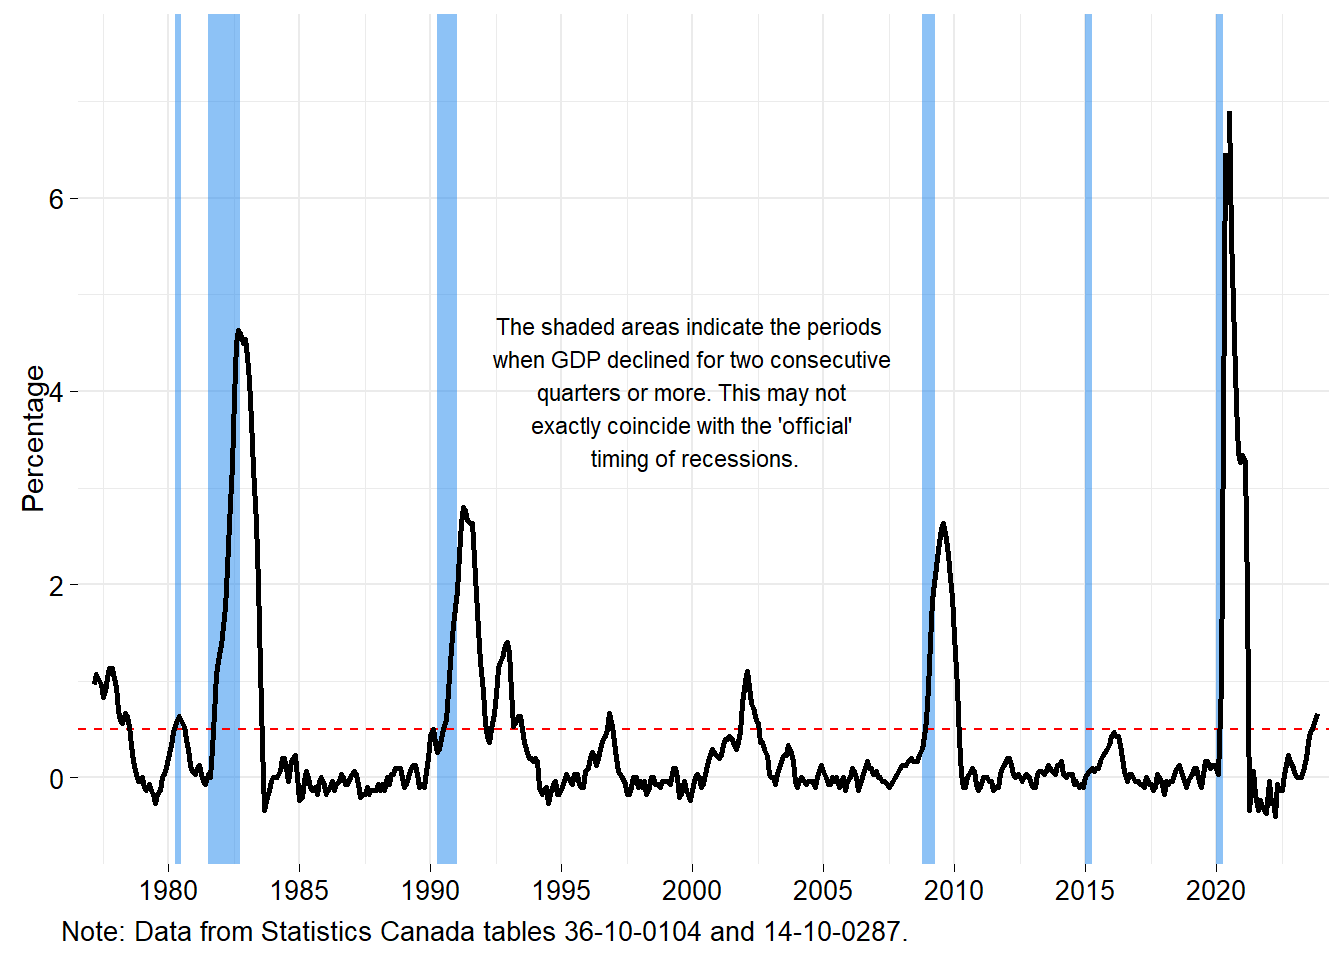
The Sahm’s rule recession indicator is an early recession indicator that compares the average unemployment rate in the last three months and the minimum monthly unemployment rate over the last 12 months. If the difference between these two values exceeds 0.5, it is a signal that a recession is beginning.
The figure below shows the Sahm’s rule recession indicator for Canada. The latest employment data are for November 2023. The figure shows that the indicator has been rising and has been above 0.5 for the last three months. This tells us that Canada is on the brink of a recession, but the signal is still weak. In previous recessions, the indicator sharply rose.
Figure 3: Sahm's rule recession indicator for Canada
Labour market strength: the vacancy to unemployment ratio
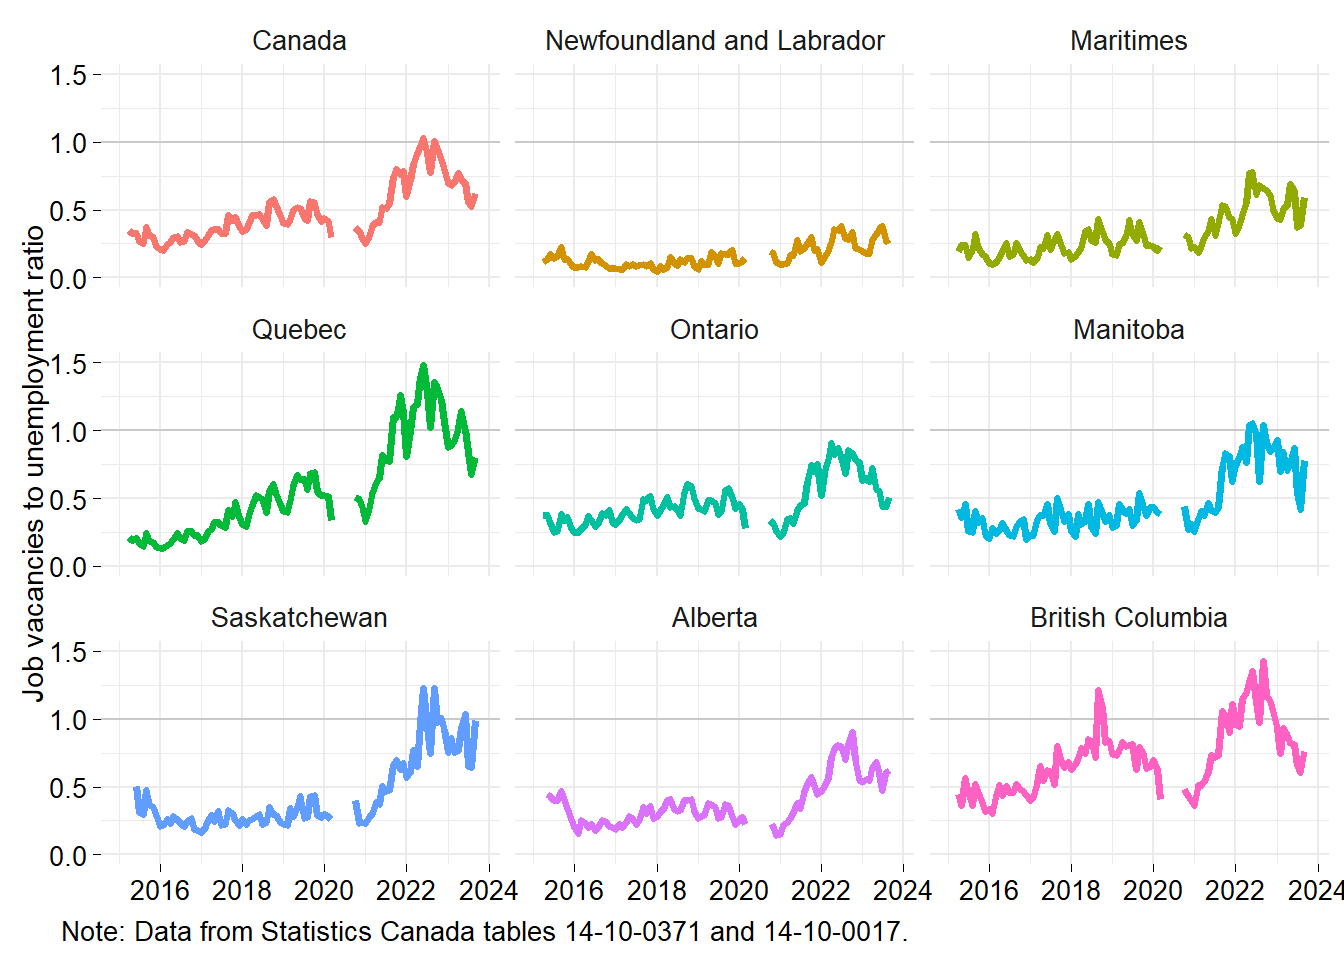
The vacancy to unemployment ratio is not a recession indicator but it offers a good measure of the strength of the labour market. The ratio tells us how many jobs there are available for each unemployed worker. A ratio above 1 means there are more jobs available than there are workers looking for a job.
The figure below shows the ratio peaked in the middle of 2022. The labour market was particularly tight in Quebec and British Columbia, but has softened over the last year in part because of the influx of immigrants. Nonetheless, it is still strong compared to before the pandemic.
The labour market appears in a strong position such that if a recession arises, it should not affect workers like previous recessions. That is, if Canada experiences a mild recession, we can expect the unemployment rate to stay relatively low.
Figure 4: Job vacancies to unemployment ratio
Is a recession coming?
The Sahm’s rule recession indicator says that a recession is approaching but the signal is still weak. If the indicator sharply increases in the December unemployment data, then it will be clear that we are heading into a recession. For now, the signal is still too weak to make a definitive statement from it.
The signs point toward a weaker Canadian economy in 2024. Whether this means a recession, I do not know. I agree with what appears to be the consensus among economists that the Bank of Canada will begin lowering its policy rate in 2024 and that the economy will strengthen from then on.