Blog
Estimates of damages to Canadian canola growers caused by China’s import restrictions
Sebastien Pouliot, Ph.D.Series: Agriculture
In this blog post, I estimate damages to Canadian canola growers of China’s import restrictions between March 2019 and May 2022. I use the relative price of a substitute method from Carter and Smith (2007).
I find that the trade restrictions caused a 5.5% in the price paid to Canadian canola growers. I calculate that between March 6, 2019, and May 18, 2022, China’s import restrictions caused as much as CAD 2.28 billion and as low as CAD 1.34 billion in losses to Canadian canola growers. The difference in the estimates depends on assumptions regarding how the industry mitigated the impacts of the trade restrictions. Under a scenario with a 50% mitigation rate, the damages to Canadian canola growers are about CAD 1.65 billion.
Background
On March 1, 2019 China blocked imports of canola seeds (henceforth canola) from Richardson International Ltd. A few days later, China revoked the export license of another company, Viterra Inc. China’s stated reason was the detection of pests in canola shipments from the two companies. However, it was apparent that the restrictions were a response to the arrest of Huawei CFO Meng Wanzhou in December 2022. The restrictions were lifted on May 18, 2022.
The restrictions did not entirely stop canola exports to China but significantly limited them. Although the restrictions applied to only two companies, they also reduced exports by other companies who were afraid of also seeing the export licences revoked. An outcome of the restrictions was that Canadian canola was not used where it had the most value. Indeed, canola not exported to China had to be stocked, crushed domestically or exported to other countries. The marginal value of canola in these alternative channels being lower than if exported to China, it decreased the average value of canola. That effect spread through the supply chain and resulted in lower prices paid to Canadian canola farmers.
Cardwell and Brewin (2019) show conceptually the potential impacts of the trade restrictions. The authors also discuss the possible outcomes of Canada pursuing a case against China at the WTO. Canada eventually challenged China’s trade restrictions but requested suspension of the proceedings after China lifted the restrictions. Wells and Slade (2021) estimate that the trade restrictions in the 11 first months lowered canola prices on average by 3.6%. The authors calculate producer loss between CAD 340 and CAD 370 million during that period. LeftField Commodity Research (2021) also estimated impacts of the trade restrictions. The report contains a lot of information about the various ways China’s import restrictions affected the Canadian canola supply chain. However, it is dated from February 2021, when the restrictions were still in place, and therefore does not capture the full impacts of the trade restrictions.
Canola exports
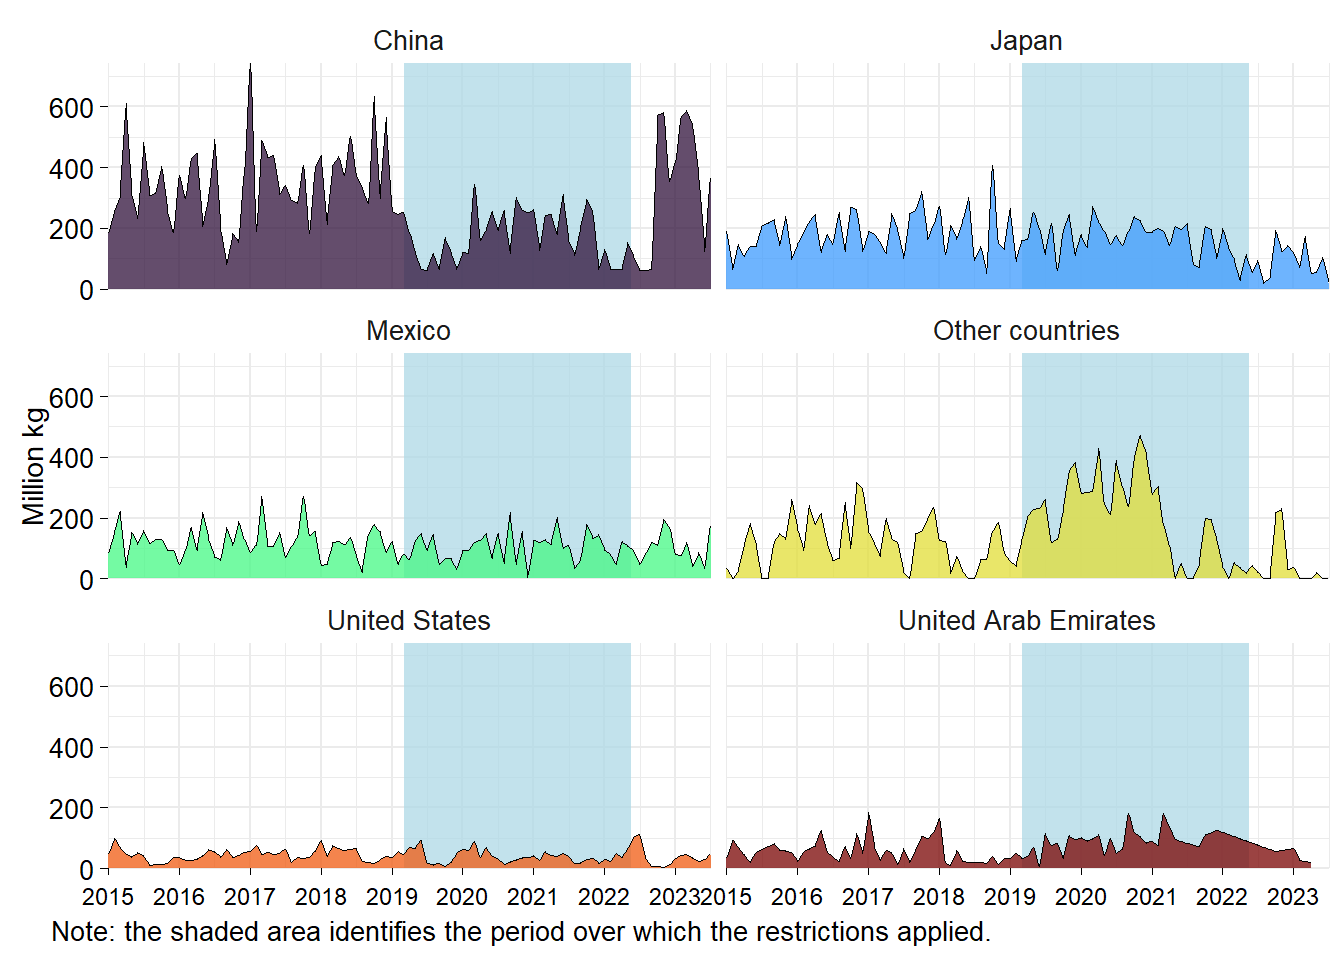
Figure 1 shows that the trade restrictions had an immediate impact on canola exports to China. China was the largest importer of Canadian canola before the trade restrictions, but its imports declined to volumes similar to Japan and Mexico afterwards.
Exports to other countries grew in response to lower exports to China. One such country that has often been mentioned is the United Arab Emirates. Figure 1 shows that exports to the United Arab Emirates increased after the ban but not enough to compensate for exports losses to China. Exports to Japan, Mexico, the United States did not materially change after China’s import restrictions. It is exports to several other countries compensated for the partial loss of the Chinese market.
Canola exports in the 2021-22 crop year were down because of the small harvest caused by the drought. This is most apparent in Figure 1 in the drop of exports to Other countries. In contrast, exports to traditionally importing countries stayed relatively constant. Exports to China did not grow immediately after the end of the restrictions because of the low volumes available following the drought. Exports to China grew to volumes comparable to those before the ban following the harvest of the 2022-23 crop.
Figure 1: Canada monthly exports of canola seeds
Price data
The relative price of a substitute method from Carter and Smith (2007) requires time series for the price of the impacted product and of a substitute product not affected by the event in question. The choice of the substitute product is critical and fortunately there are good candidates to consider.
Below I will perform the analysis using soybean as the substitute product. Canola and soybean are oilseeds with comparable attributes, and they are sometimes crushed in the same facilities. They tend to be grown in different areas, but both are inexpensive to ship. This makes soybean is a very good demand substitute to canola. As we will see, their prices tend to move in sync. This relationship is expected to continue unless an event, such as trade restrictions on one of the two commodities, breaks it. I will use futures and cash prices for canola and soybean below.
I also considered using European rapeseed as the substitute product. However, the analysis did not work as well, especially when dating the events. Rapeseed is essentially the same product as canola and therefore we should expect it to be an excellent substitute. However, rapeseed is marketed outside North America and for that reason it may be less than an ideal substitute. That is, because of distance and other economic factors, European rapeseed is an imperfect substitute to canola in Canada.
Futures
Canola futures are traded in Canadian dollars with a delivery in Saskatchewan in the event of physical settlement. Canola futures anchor prices paid to Canadian farmers for canola. Soybean futures are traded in US dollars, converted here into Canadian dollars, with a physical delivery in Illinois. They anchor soybean cash prices in North America.
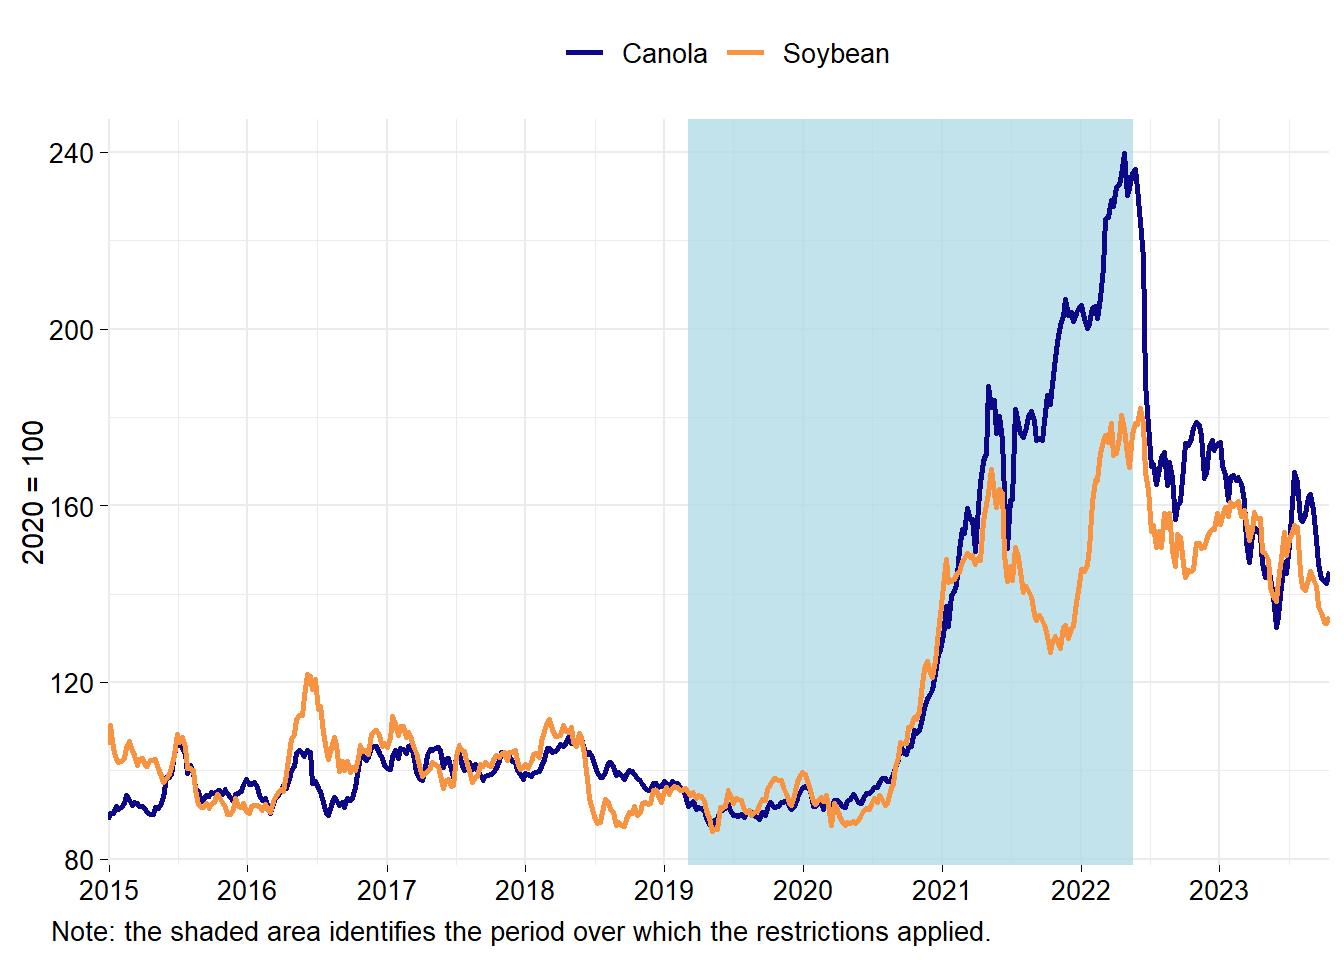
Figure 2 shows daily indexes for canola and soybean nearby futures. Between 2015 and 2020, prices for the two commodities were stable. Starting in the second half of 2020, futures for canola and soybean started climbing. Their prices began to deviate in the second half of 2021 with the drought affecting the Canadian Prairies. It appears that the drought sufficiently contracted the supply of canola to break the relationship between canola and soybean prices. That relationship was reestablished with the end of the China’s import restriction and the 2022 harvest.
We cannot visually detect from Figure 2 an obvious impact of the ban on canola futures relative to soybean futures. That does not mean, however, that there isn’t one.
Figure 2: Futures for canola and soybean
Cash
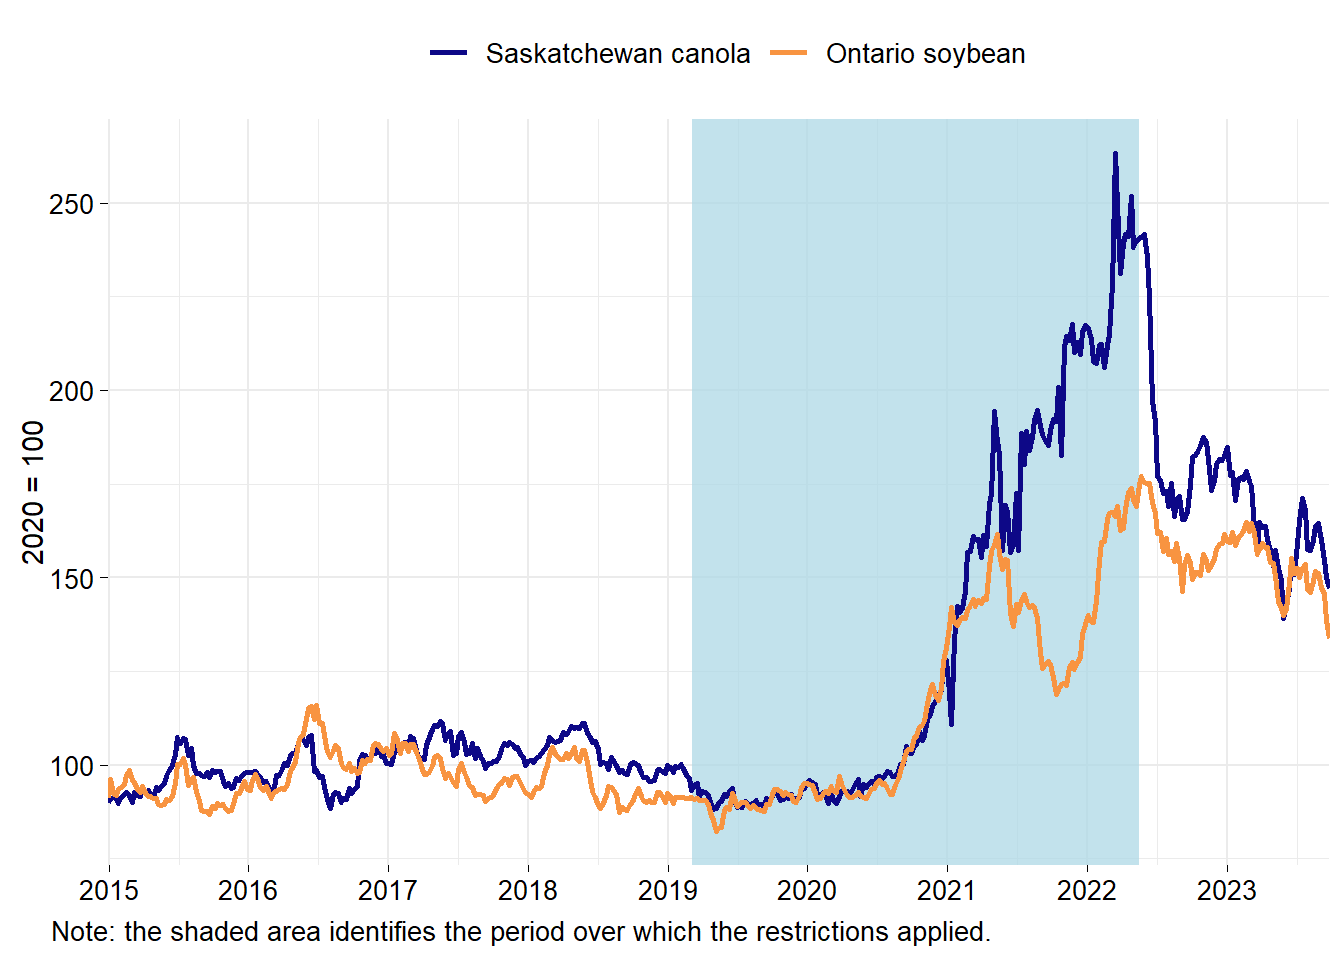
Figure 3 shows weekly average cash price indexes for Saskatchewan canola and Ontario soybeans. The price data for Saskatchewan canola are from the Government of Saskatchewan. The Ontario soybean price data are from the Grain Farmers of Ontario. Saskatchewan is the largest canola producing province while Ontario is the largest soybean producing province. Therefore, prices in those provinces are representative of prices paid for canola and soybean in Canada.
Figure 3 is similar to Figure 2, as expected because cash prices are based on futures. Like in Figure 2, we cannot visually detect in Figure 3 an obvious impact of the ban on the canola cash price relative to the soybean cash price. Again, that does not mean that there isn’t one.
Figure 3: Saskatchewan canola and Ontario soybean prices
Dating events
The first step in the price of a substitute method is to identify when an event affected the relative prices of the two substitute products. It may appear obvious that China’s import restrictions impacted the price of canola right away, but this may not be the case for a few reasons. China had already notified Canada in January 2019 that it had found pests in canola shipments and placed Richardson Ltd. on a warning list, and that more severe actions were possible (see Wells and Slade 2021). It could be that the market anticipated that China would retaliate to the arrest of Meng Wanzhou by banning Canadian canola. Perhaps there were rumours in China that this would happen and Chinese traders stopped ordering Canadian canola before the March 2019 announcement. Hence, trade restrictions may have effectively applied before they were announced.
Below, I use statistical methods to detect breaks in the log of the canola-soybean price ratio. This will tell us if and when the trade restrictions affected the price of canola relative to the price of soybeans, the substitute product being not directly affected by the trade restrictions.
Futures
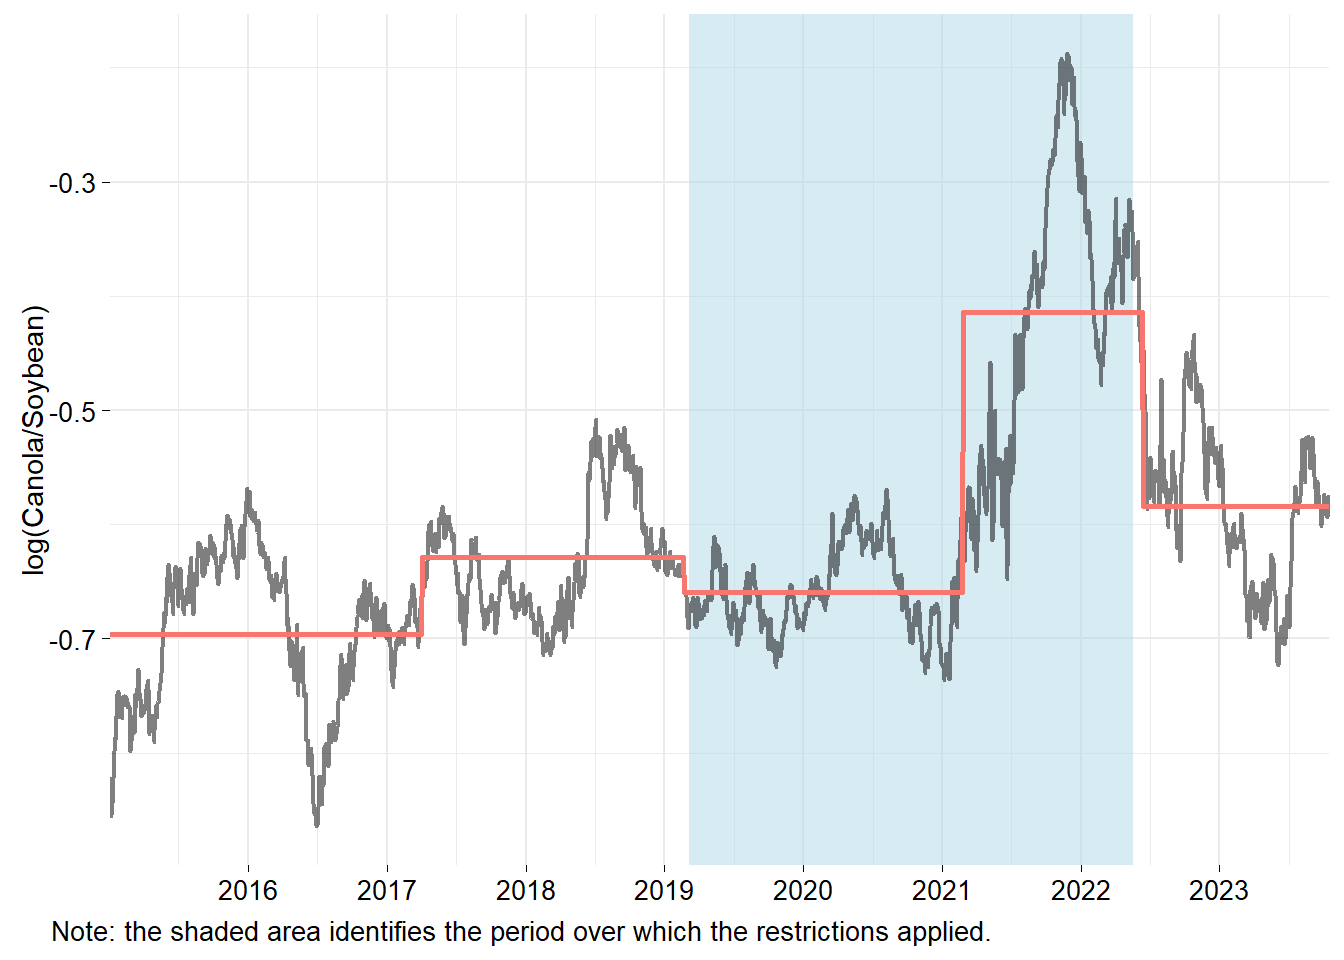
Figure 4 shows the log of the canola and soybean futures ratio. The orange line shows the mean of the log ratio conditional on the structural breaks detected by the model. The model detects four breaks:
- March 31, 2017: I do not know the reason for this break. Controlling for it in the regressions stabilizes the relationship between canola and soybean futures.
- February 19, 2019: This break corresponds to China’s import restrictions. It is earlier than the actual restrictions likely because the market thought that restrictions were coming soon.
- February 23, 2021: This break reflects the deviation in the canola futures vis-à-vis the soybean futures. Most likely, it is related to the drought in the Canadian Prairies.
- June 10, 2022: This break closely fits with the end of the import restrictions on Canadian canola.
For the purpose of estimating damages, it is the detection of a break in February 2019, closely matching the date of the announcement of the trade restrictions, that is the most important. We will use that break to estimate the price impact of the ban using futures.
Figure 4: Structural breaks in the log of the ratio of canola and soybean futures
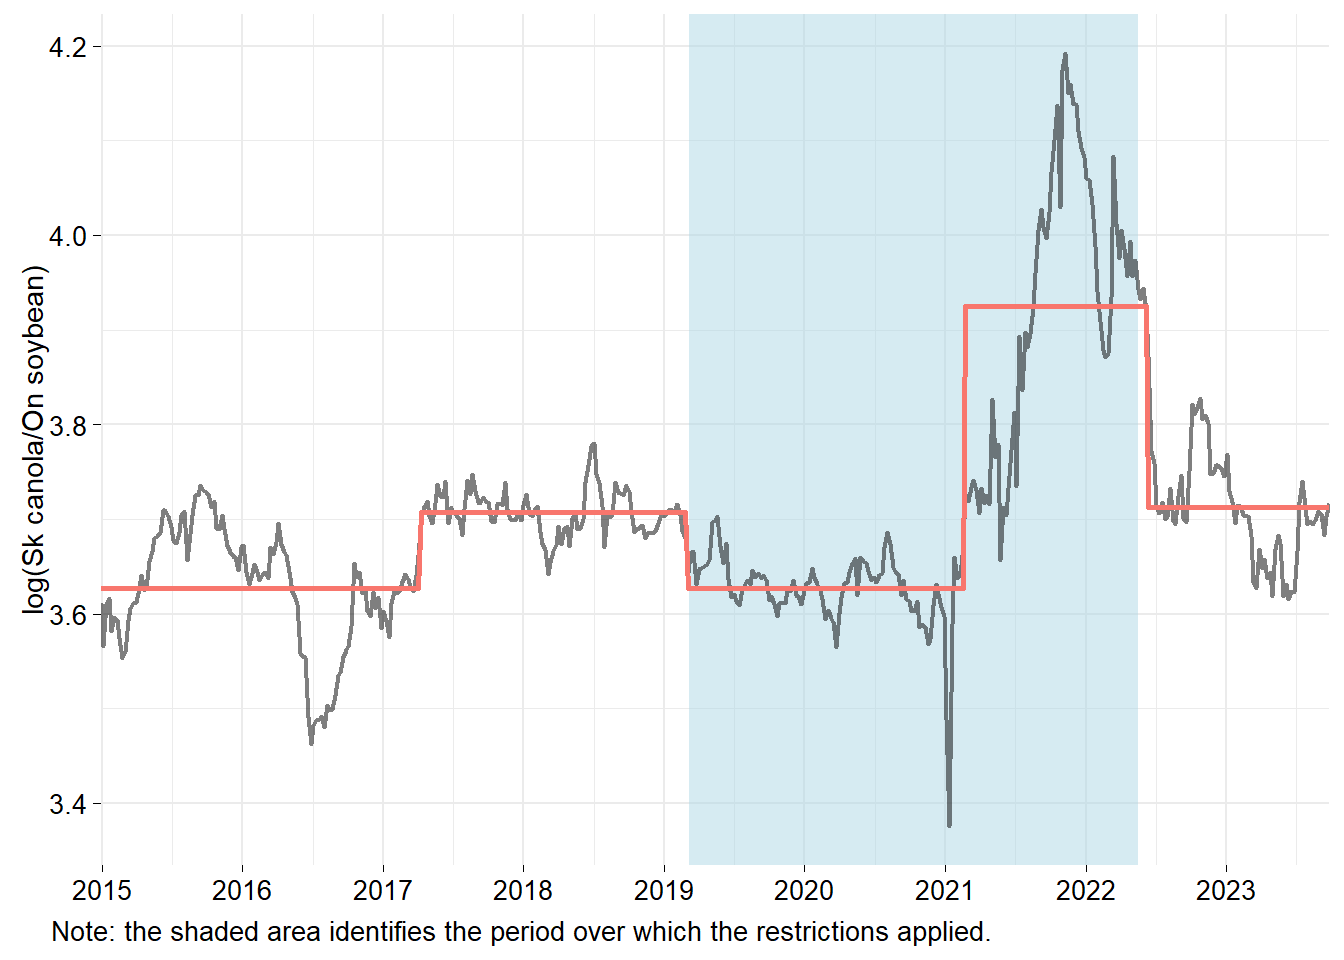
Cash
Figure 5 shows the log of the canola and soybean cash-price ratio. The units on the price data are different than in Figure 4, explaining the different scale on the vertical axis. The model detects four breaks that closely match with those detected with the futures data:
- April 3, 2017: This is the same unknown first break as with the futures data.
- February 25, 2019: This break corresponds to China’s import restrictions.
- February 15, 2021: This break reflects the deviation in the canola prices vis-à-vis soybean prices likely caused by the drought.
- June 6, 2022: This break closely fits with the end of restrictions on Canadian canola.
Figure 5: Structural breaks in the log of the ratio of canola and soybean cash prices
Estimates of price impacts
After having determined that the trade restrictions effectively affected canola prices relative to soybean prices, I can estimate another set of models to calculate the price impacts of the trade restrictions. From these models, I can predict prices without trade restrictions and use these predictions to calculate the price impacts of the trade restrictions. One choice I must make is the length of the prediction I will use to calculate the price impacts. My objective is to estimate the immediate impacts of the trade restrictions and therefore I must consider a relatively short period. With time, the industry can mitigate the impacts of the trade restrictions by learning to organize shipments to other countries at lower costs or finding new market opportunities domestically.
Table 1 shows the estimated price impact of the trade restrictions on futures and cash prices for canola over a period varying between 4 and 24 weeks. The estimated impacts in percentages are lower when estimated using futures data. This is not surprising because the average basis for Saskatchewan canola was negative such that the absolute price impacts of the trade restrictions are similar whether they are measured using futures or cash prices. The price impacts are smallest over the first four weeks, indicating that it took time for prices to fully decline in response to the trade restrictions. The impacts grew for the first 12 weeks and then stabilized at about -5.5% for futures and -5.9% for cash prices.1
To calculate damages, I’ll use the estimated price impacts for the first 16 weeks. The trade restrictions caused a 5.5% drop in the futures, with a 95% confidence interval of [-5.9%, -5.0%]. The restrictions caused a 5.9% drop in the cash price for canola, with a confidence interval of [-6.9%, -4.9%].
|
Confidence interval (%) |
|||
|---|---|---|---|
| Number of weeks | Estimate impact (%) | 2.5% | 97.5% |
| Futures | |||
| 4 | -3.7 | -4.1 | -3.3 |
| 8 | -4.5 | -4.9 | -4.1 |
| 12 | -5.7 | -6.2 | -5.3 |
| 16 | -5.5 | -5.9 | -5.0 |
| 20 | -5.4 | -5.8 | -5.0 |
| 24 | -5.5 | -5.8 | -5.1 |
| Cash | |||
| 4 | -4.6 | -6.0 | -3.1 |
| 8 | -5.5 | -6.7 | -4.4 |
| 12 | -6.4 | -7.5 | -5.2 |
| 16 | -5.9 | -6.9 | -4.9 |
| 20 | -5.9 | -6.7 | -5.0 |
| 24 | -5.7 | -6.5 | -4.9 |
Damage estimates
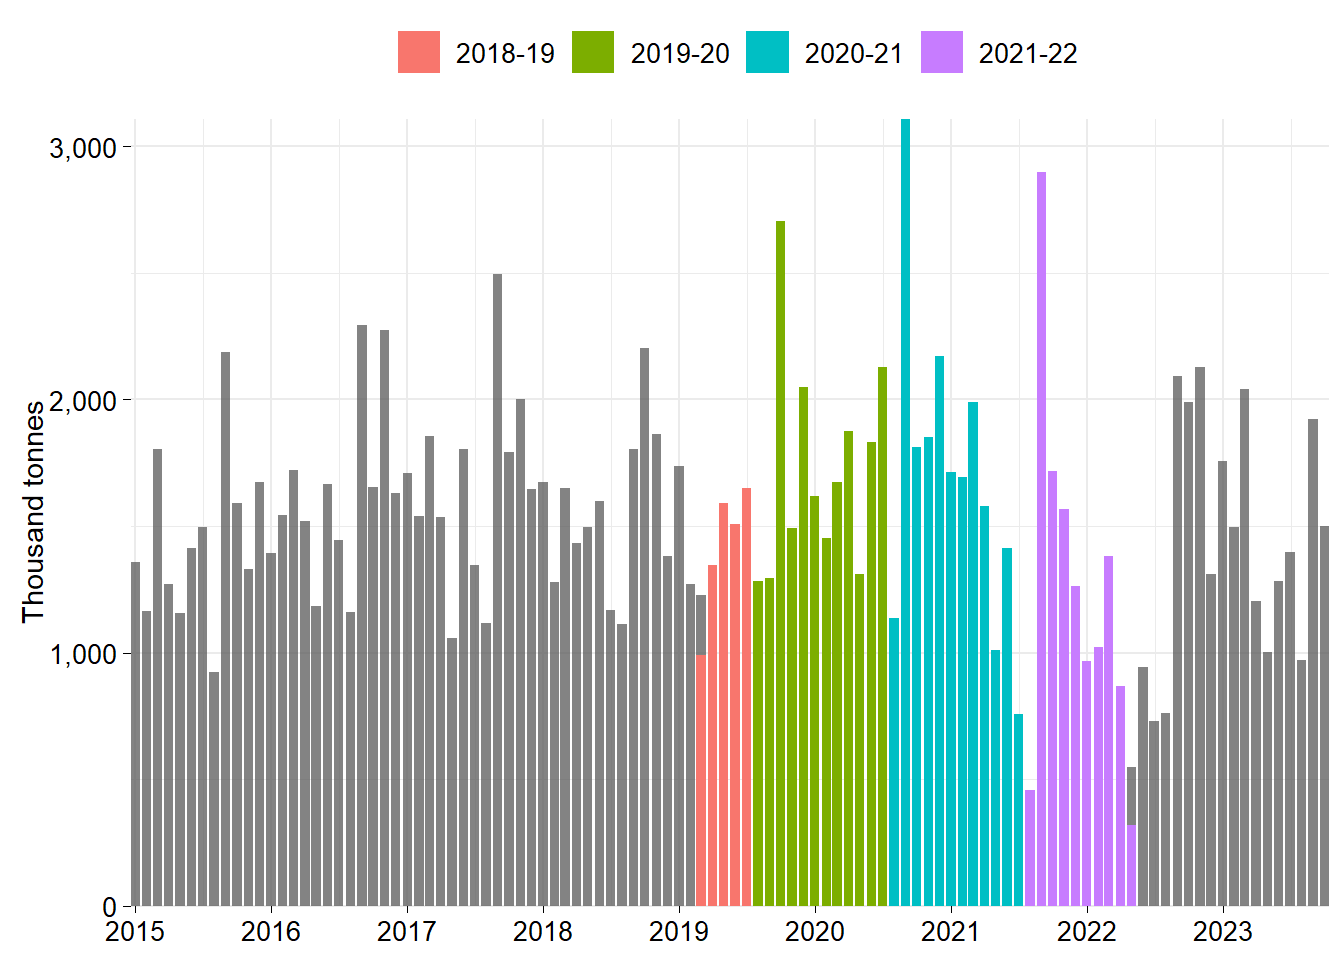
The last step is to calculate damages by combining the estimated price impacts with the volumes of canola delivered by canola producers. It would be more accurate to calculate damages using volumes of canola priced between the start and the end of the trade restrictions. However, I do not have the data to perform those calculations and producer deliveries should yield a good approximation.
Figure 6 shows Canadian producer canola deliveries from Statistics Canada table 32-10-0351. The deliveries affected by the trade restrictions are coloured according to the crop years. The trade restrictions impacted canola delivered for parts of the 2018-19 and the 2021-22 crop years and the entirety of the canola delivered through the 2019-20 and 2020-21 crop years. Observe the lower volumes for the 2021-22 crop year because of the drought. This may have increased or lowered the price impacts of the trade restrictions. I am agnostic about the sign of the effect of the drought and thus will assume that it does not affect the price impact of the trade restrictions.
Figure 6: Producer canola deliveries impacted by the trade restrictions
Following the initial shock, the canola supply chain likely found ways to mitigate the impacts of the trade restrictions. To consider mitigation, I developed two scenarios where the price impacts are gradually lowered by the end of the trade restrictions as low as 50% and 25% of the initial price impact. For example, the estimated initial price impact on futures is 5.5%. In the scenario where the impacts are mitigated at a 50% rate, the impact is 2.25% on the day the restrictions were removed.
Table 2 shows the estimated damages to Canadian canola growers of China’s restrictions on canola imports. The impacts are very similar when calculated with futures or cash prices data. Considering no mitigation such that the full impacts of the ban continue through the duration of the trade restrictions, the damages are as high as CAD 2.23 billion based on futures and CAD 2.28 billion based on cash prices. Assuming the canola supply chain was able to mitigate the initial impacts of the trade restrictions, the estimated damages are as low as CAD 1.34 billion using futures and CAD 1.36 billion using cash prices.
Assuming a 50% mitigation rate, the damages caused by the trade restrictions were around CAD 1.65 billion. This is significant to Canadian canola growers and shows that even partial trade import restrictions can have important consequences. It demonstrates the importance of diversifying the portfolio of importing countries for canola and other agricultural commodities.
| Crop year | Full impact | Impact is 50% by the end | Impact is 25% by the end |
|---|---|---|---|
| Futures | |||
| 2018-19 | 184.6 | 182.9 | 182.0 |
| 2019-20 | 555.1 | 488.2 | 454.8 |
| 2020-21 | 778.9 | 557.5 | 446.8 |
| 2021-22 | 714.2 | 407.0 | 253.4 |
| Total | 2,232.8 | 1,635.6 | 1,337.0 |
| Cash | |||
| 2018-19 | 186.7 | 185.0 | 184.1 |
| 2019-20 | 557.0 | 489.8 | 456.3 |
| 2020-21 | 779.1 | 557.6 | 446.9 |
| 2021-22 | 755.1 | 430.4 | 268.0 |
| Total | 2,277.9 | 1,662.8 | 1,355.3 |
References
Cardwell, Ryan, and Derek G Brewin. 2019. “Blackleg or Blackmail? Economics of the Canada–China Canola Trade Dispute.” Canadian Journal of Agricultural Economics/Revue Canadienne d’agroeconomie 67 (3): 251–60.
Carter, Colin A, and Aaron Smith. 2007. “Estimating the Market Effect of a Food Scare: The Case of Genetically Modified Starlink Corn.” The Review of Economics and Statistics 89 (3): 522–33.
LeftField Commodity Research. 2021. “Case Study - Impacts of the Chinese Trade Restrictions on the Canadian Canola Industry.” 2021. https://www.canolacouncil.org/wp-content/uploads/2021/03/CCC-Market-Access-Impact-Report-China-Final.pdf.
Wells, Jacob, and Peter Slade. 2021. “The Effect of the Canada–China Canola Trade Dispute on Canola Prices.” Canadian Journal of Agricultural Economics/Revue Canadienne d’agroeconomie 69 (1): 141–49.