Blog
What do recession indicators tell us?
Sebastien Pouliot, Ph.D.Series: macro
Tags: yield, recession, inflation, interest rates, Bank of Canada
The Bank of Canada (BoC) adopted quantitative tightening measures and raised its target rate by 4% in 2022 in an effort to jugulate inflation. The objective is to slow down economic activity to relieve pressure on prices. The big question is whether a soft landing is possible, where the BoC brings the inflation back toward its 2% target without causing a recession.
Before the pandemic happened, I would frequently hear about the inversion of the yield curve, a historically reliable signal of an upcoming recession. However, this time around, I don’t hear much about the inversion of the yield curve even though fear of a recession is very much present.
I check what two indicators say about an upcoming recession. They are reputed to be reliable recession indicators for the United States. As far as I know, their validity is less proven for Canada. Nonetheless, they are useful for a better understanding of the current macroeconomic environment.
Yield curve
The yield curve shows the relationship between the yields and the maturity of treasuries. In a normal market, yields increase with maturity as investors ask for a higher return on long-term investments as they are riskier. However, when the yield curve inverts, yields decline with maturity. This reflects an unusual situation where investors consider the near term as riskier than the long-term. Hence, the yield curve is market signal that reveals investors’ expectations regarding the economy for the short and the long term.
We can look at the spread between different maturities to determine when an inversion of the yield curve occurs. Here, I’ll follow the convention of comparing yields for the 3-Month treasury bill and the 10-Year bond. This allows for a prediction of a recession over the next quarter given treasury bill with a 3-Month maturity.
Canada
The animation below shows the yield curve between January 2018 and December 2022 using two panels. The panel on the left shows the yield curve: on the horizontal axis is maturity increasing from left to right and on the vertical axis is the yield. The panel on the left compares the yield on the 3-Month treasury bill and the 10-Year bond. The area in blue shows the spread when the yield on the 10-Year bond exceeds the yield on the 3-Month treasury bill. The area in orange shows the spread when the yield on the 10-Year bond is lower than the yield on the 3-Month treasury bill, that is, when the yield curve is inverted.
Since 2018, the yield curve has inverted twice. The first time was just before the pandemic. There was a fear of an upcoming recession at the time albeit the inversion was small. With the COVID-19 pandemic happening, we had a recession, but it was for entirely different reasons. The second inversion began last August, and it is still ongoing. The inversion is more severe with the spread exceeding 1%. This shows that investors prefer not to invest in the short term, perhaps because they are waiting for interest rates to decline or because they see the current economic environment as too risky.

The next animation shows this time the effective interest rates paid by households and businesses on the right panel. The animation shows that the effective interest rates charged to households and businesses respond to changes in the BoC target rate and shifts of the yield curve. Interest rates have climbed at a spectacular pace since the BoC began raising its target rate in February. Also notice the reversal.1 Household typically pay a higher effective interest rate than businesses but this is no longer true since August.
I’m not sure of what’s the explanation for that reversal. For sure something in the economic environment has changed over the last few months to cause the inversion but I cannot offer a definitive explanation. I’m guessing the inversion of the yield curve might have contributed but I don’t know exactly how.

United States
You know the saying, “When the US sneezes, Canada catches cold?” If true, it’s fair to say that the risk of a recession in Canada depends on the risk of a recession in the US. The animation below shows the US yield curve. Yields in the US have followed patterns very similar to Canada. The Federal Reserve increased its target rate by 4.25% in 2022 compared to 4.00% for the BoC.
The yield curve inverted in the United States in the middle of 2019 but the inversion was minor. The Federal Reserve cut its target rate three times in 2019, limiting the inversion of the yield curve. The yield curve inverted a second time starting in late October 2022. The yield on the 3-Month treasury bill exceeded the yield on the 10-Year bond by more than 0.80% in December. The US treasury market signals a recession could be upcoming in the United States.

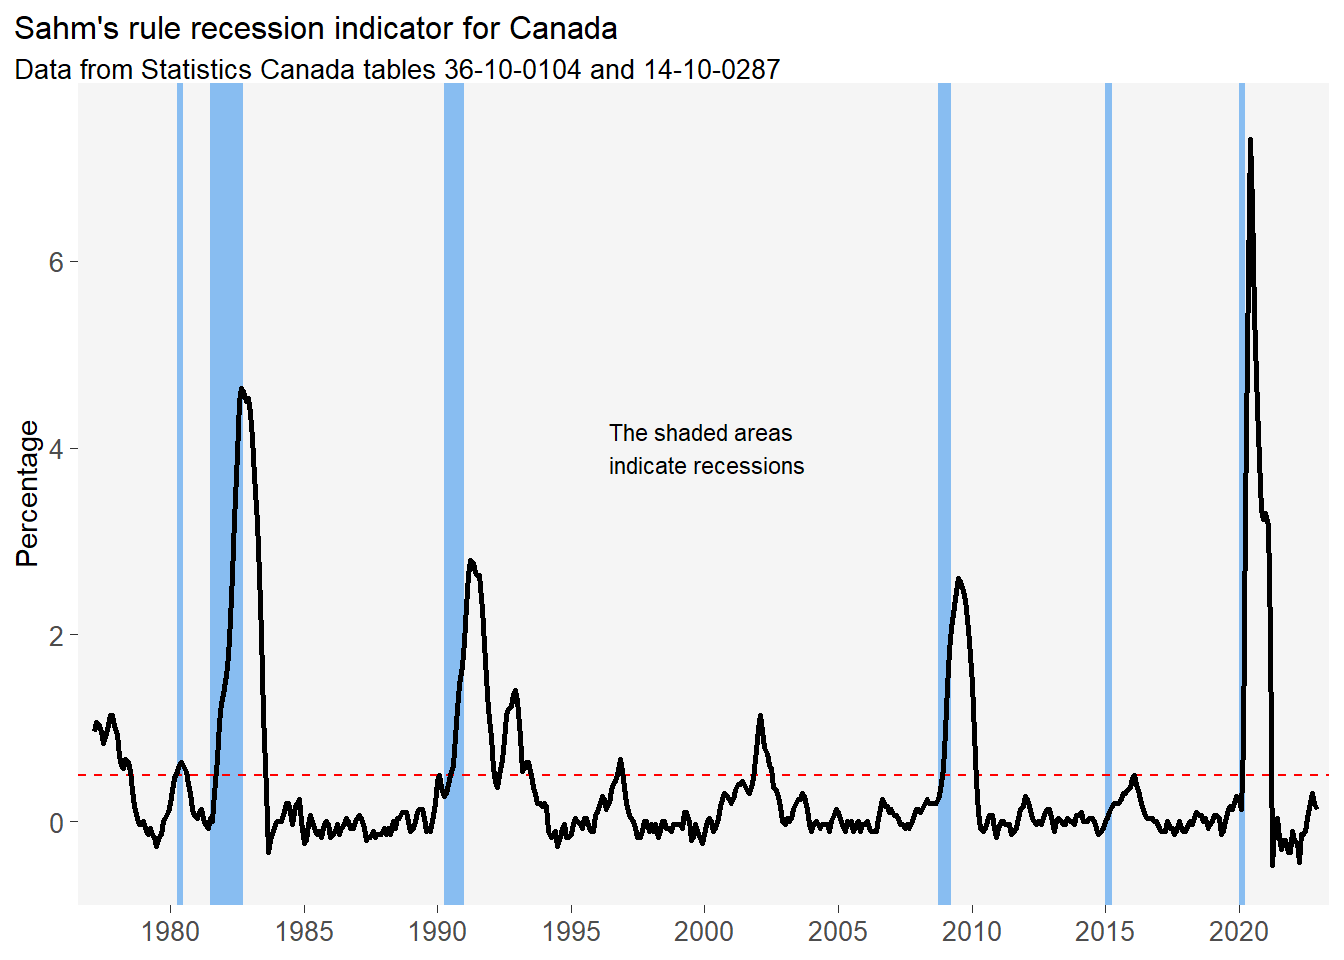
Sahm rule recession indicator
The Sahm rule recession indicator was proposed by Claudia Sahm in 2019. GDP data are available with significant lags such that a country learns of a recession several months after it began. The Sahm rule recession indicator uses unemployment data, available before the GDP data, as an early signal of an economic downturn. The proposal by Claudia Sahm is for direct payments to individuals to kick in when the indicator surpasses a 0.50% threshold (hence the rule), which would make a governmental response to a recession quick and automatic. The Sahm rule was even part of the Conservative Party platform in the 2021 federal elections.
The Federal Reserve publishes a real-time Sahm rule recession indicator. The figure below shows the Sahm rule recession indicator for Canada. I identify recessions as at least two consecutive quarters with negative GDP growth. The dates might not be the same as the official dates but they should be close. This paper shows that the Sahm rule worked well in detecting the 2008-09 recession in Canada.
The latest employment data are for December 2022. The figure shows that the indicator is below the 0.50% threshold but that it has been increasing over the last few months. This suggests that Canada is still not at the brink of a recession but that we should monitor the evolution of the indicator in the coming months.
Conclusion
The yield curve and the Sahm rule recession indicator appear to give opposite signals. How can we make sense of this? As Campbell Harvey, who first linked the inversion of the yield curve to recessions, points out in this interview, the yield curve is a window into the future while unemployment is a lagging indicator. Thus, it could be that Canada is already in a recession or that one will begin soon, but that the labour market does not reflect this yet.
If we have a recession, it likely will be different than any other we had before. It will be painful but it could be easier to ride than past recessions. Indeed, the labour market is so strong currently that it’s hard to imagine that the unemployment rate could rise at levels observed in previous recessions. In any case, let’s hope that the BoC controls the inflation while landing the economy softly.
-
I’m purposely avoiding the word inversion so not to cause confusion. ↩︎